Bowel movements, losing weight while sleeping, and other questions 💩
20 Jan 2020 —Although I started this whole personal weight analysis thing because I thought I was going to start dieting, I quickly realized that frequent fine-grained weight measurements could serve other, more experimental purposes.
Finally, the scatological blog post you’ve all been waiting for! 💩💩💩
Part 4: Bowel movements, losing weight while sleeping, and other questions
For background on the project this post stems from, check out Part 1, Part 2, and Part 3 of this series.
Note to all possible future employers:
Stop reading now.
By all that is good and true in this world, close out of this tab and just forget about this post.
I promise you that there is nothing offensive in this post, nothing even politically incorrect. But I cannot promise you that you will not be grossed out by this post. You have every right to be. You might even come to the conclusion that my undertaking here crosses the borders of “juvenile” or that I have the mind of an eleven year-old.
And if you did, you would be right.
But in my defense, I believe the taboo nature of the topics I will be touching upon1 is increasingly a relic of the past. For, in the immortal words of that hallowed book: “Everyone poops.”

The book I remember reading in my grandparents' house: Everyone Poops, by Tarō Gomi. (Taken from Wikipedia)
Why am I like this?
About a day after planning my weight loss measuring journey, I realized that the scale system I was coming up with could also measure very short term weight losses/fluctuations. Within minutes, I realized that I could use a before-and-after system to weigh my own bodily functions.
Yes, bowel movements.
I mean, it makes sense! The heaviest short-term weight fluctuations are going to be from eating food and getting rid of that food. It’s only natural for my mind to go there!
While, yes, I did consider the utility of developing a more… “detailed” scatological corpus for wider medical use, after speaking with a few friends involved in medical fields, I decided that the need was just not there.
But understanding more about one’s excretory habits has vital importance for understanding one’s own personal health, and haven’t you ever wondered how much your poop weighs?
Anyway, I came up with roughly three areas of interest about my weight:
My questions:
-
How much weight, if any, do I lose in my sleep? How do my sleeping habits affect my overall weight?
-
How much does my average bowel movement weigh? How do the different types of excreta compare? Do these habits have any bearing on my overall weight?
-
How do other habits impact fluctuations in my weight?
See? Only one of my questions has to do with poop!
Technical background
I have developed a local Flask website that interfaces with the Bluetooth monitoring system that’s running on a RaspPi in my house, letting me “tag” different weight recordings with meta-data via browser.2 I’m pretty dang satisfied with what I’ve built3, but the one major kink in my pipeline is the fact that the Bluetooth/scale part can only run in Python 2, while everything else runs in Python 3.4
For better or for worse, the system I’ve created essentially work with two stacks: a stack of weight data and a stack for the meta-data, and as weights and tags are put onto these stacks, it attempts to link weights to tags. So far this has worked great.
But to measure short-term weight changes, I needed to record my weight both before and after a change, and supply meta-data that would let me know what kind of change I was measuring. Finding the difference in the before-and-after measurements would let me know exactly how much weight I lost. While my system for linking meta-data to the individual weights works great, my system for linking the two before-and-after measurements is a little more of a pain. Mostly because of how forgetful I am.
I forget to tag some weight measurements, I forget to weigh myself again to complete a “before-and-after” measurement, etc. When I came up with the design that I did, I figured that these problems would arise, but that I would have the chops to deal with them in “post” and clean the data up afterwards. Leaving all the hard work for future me. But let’s put that on hold for now.
Question 1: Do I lose weight in my sleep?
One of the questions I thought would be interesting to ask with this system is whether my weight changes from when I go to sleep to when I wake up, and if so, by how much.
To measure this change, I measured my weight immediately before and after I slept, and tagged each of these weights with that information. According to science blogger Derek Muller and NPR, we lose about a pound of weight in our sleep per night. Is that what my data says?
The baby solution
The simplest solution would be to filter all the weight sleep/wake measurements and do a t-test to see if the two category means are different.
This is the easy way—I don’t have to link ‘before’ and ‘after’ measurements—I can count on the fact that they’re mostly probably paired up, and if there’s a difference, the noise might not be too much of a problem. But before we do that, let’s look at the data:
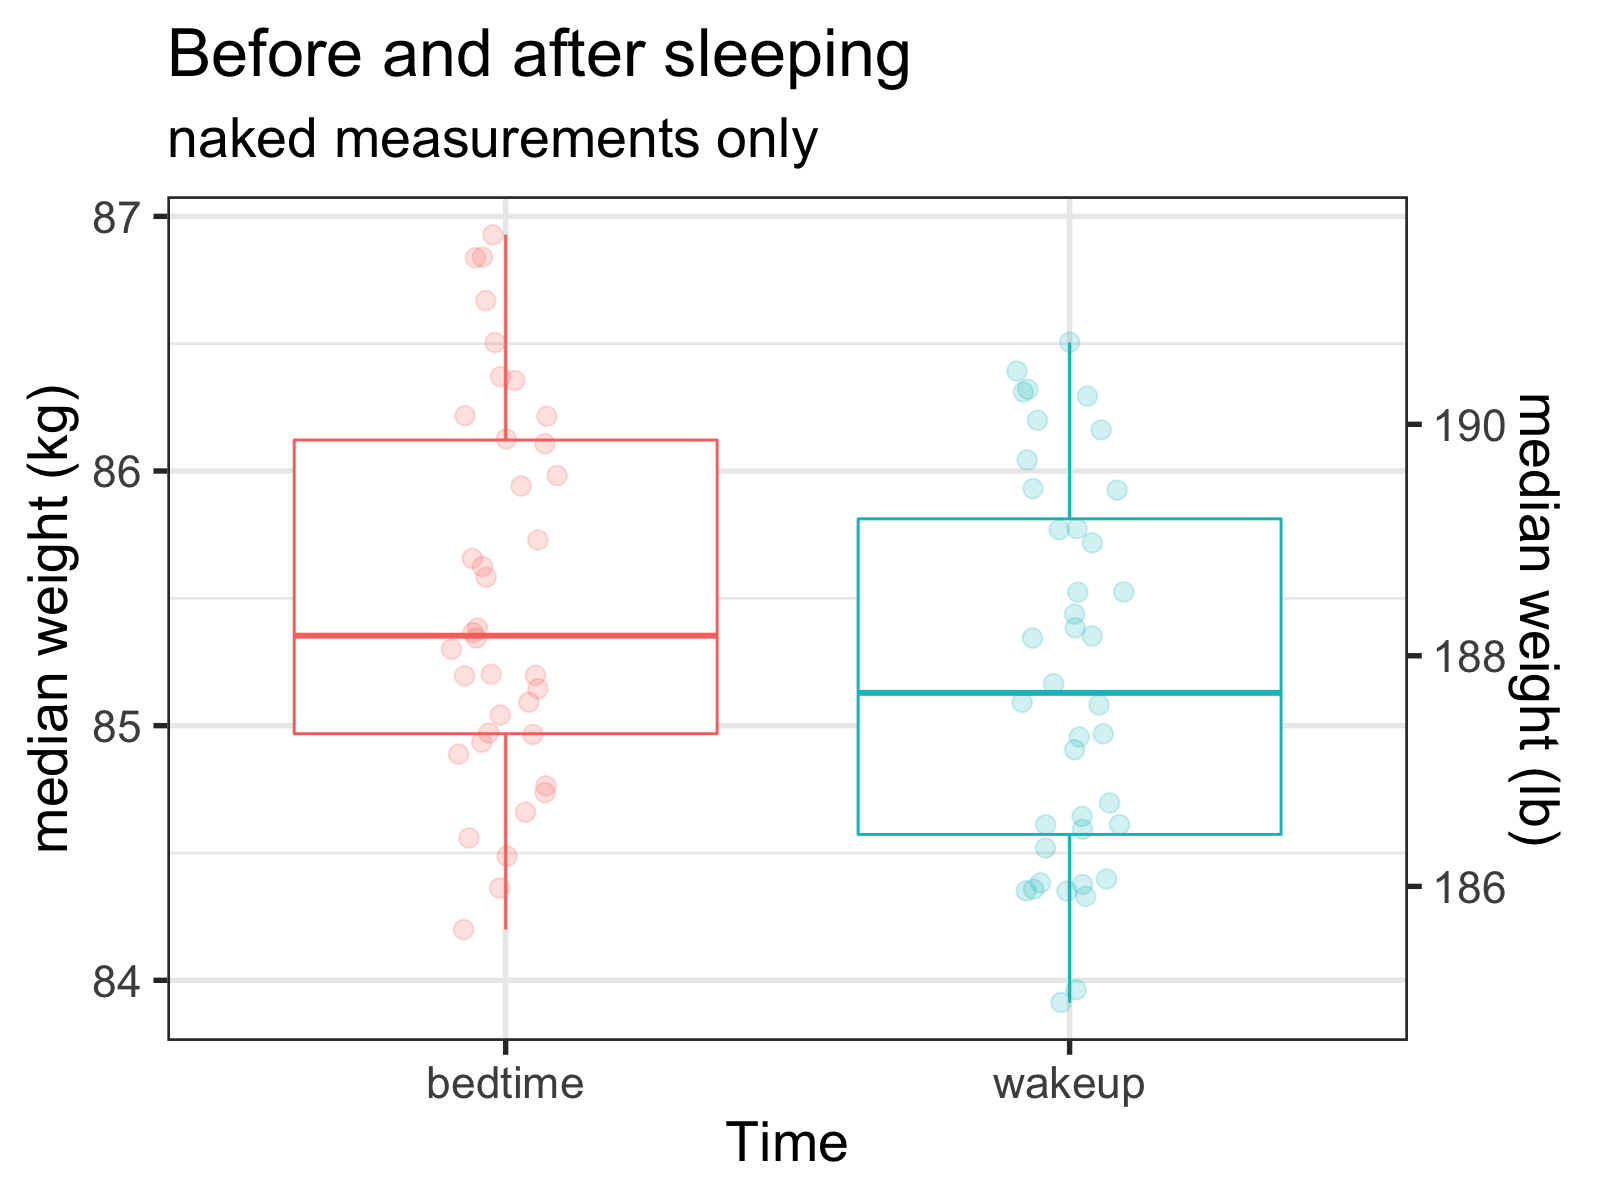
Although the data is certainly noisy, it looks like I’m relatively close to that mark (~0.68 lbs). But is this weight loss significant?
##
## 	Welch Two Sample t-test
##
## data:  bedtimes and wakeups
## t = 1.8133, df = 75.861, p-value = 0.07374
## alternative hypothesis: true difference in means is not equal to 0
## 95 percent confidence interval:
##  -0.06687966  1.42636847
## sample estimates:
## mean of x mean of y
##  188.5232  187.8435
Womp womp! Looks like it isn’t! But can we do better? What if I’m able to link the ‘before’ and ‘after measurements?
Fixing it in ‘post’
I wanted to create an entirely separate blog post about how I approached this problem, but I think I’ve gone on enough about this project as-is. I’ll just say that my approach to how best to link these values in post was a lesson in how “worth it” it is to approach problems in a principled, thoughtful way: by considering the problem as a whole, I was able to whip up some very general code that solved all my problems in one go.
I really wanted to brag about it use it as a introduction to the design choices that programmers have to make, but that will have to be sometime later. If you’re interested in the code, you can look at the R (commented) code in the source file of this post.5
Long story short, I was able to break the problem up into easier, more manageable pieces, and use what I know about how these measurements were taken to link them together.
Big boy solution
Ok, so what happens if we use my code to match up the corresponding sleep/wake measurements? We can essentially turn it into a paired t-test, for one. Each ‘before’ measurement (i.e., when I went to bed) has a corresponding ‘after’ measurement (when I woke up).
##
## 	Paired t-test
##
## data:  paired_bedtimes and paired_wakeups
## t = 9.6174, df = 23, p-value = 1.588e-09
## alternative hypothesis: true difference in means is not equal to 0
## 95 percent confidence interval:
##  0.838260 1.297693
## sample estimates:
## mean of the differences
##                1.067976
Not only does using these paired measurements make the difference significant, but we see that the difference is almost exactly what was previously reported: 1.068 lbs! Props to Derek!
Question 2: Potty talk
Alright, this is more of a series of questions than a single one. I’m generally curious about what the data looks like, but there are some hard questions as well, like comparing the weights of the type of bowel movements, etc. But before we get to the specific questions, let’s just see what the data looks like, starting with the data for the ‘poop’ measurements.
Note on my methodology: I measured the entire weight of a bowel movement as a single measurement, so a “#2” included both the weight of the solid and liquids released. I’m interested in the topic, but not enough to do one after the other, measuring myself in between!
psych::pairs.panels(poo_df)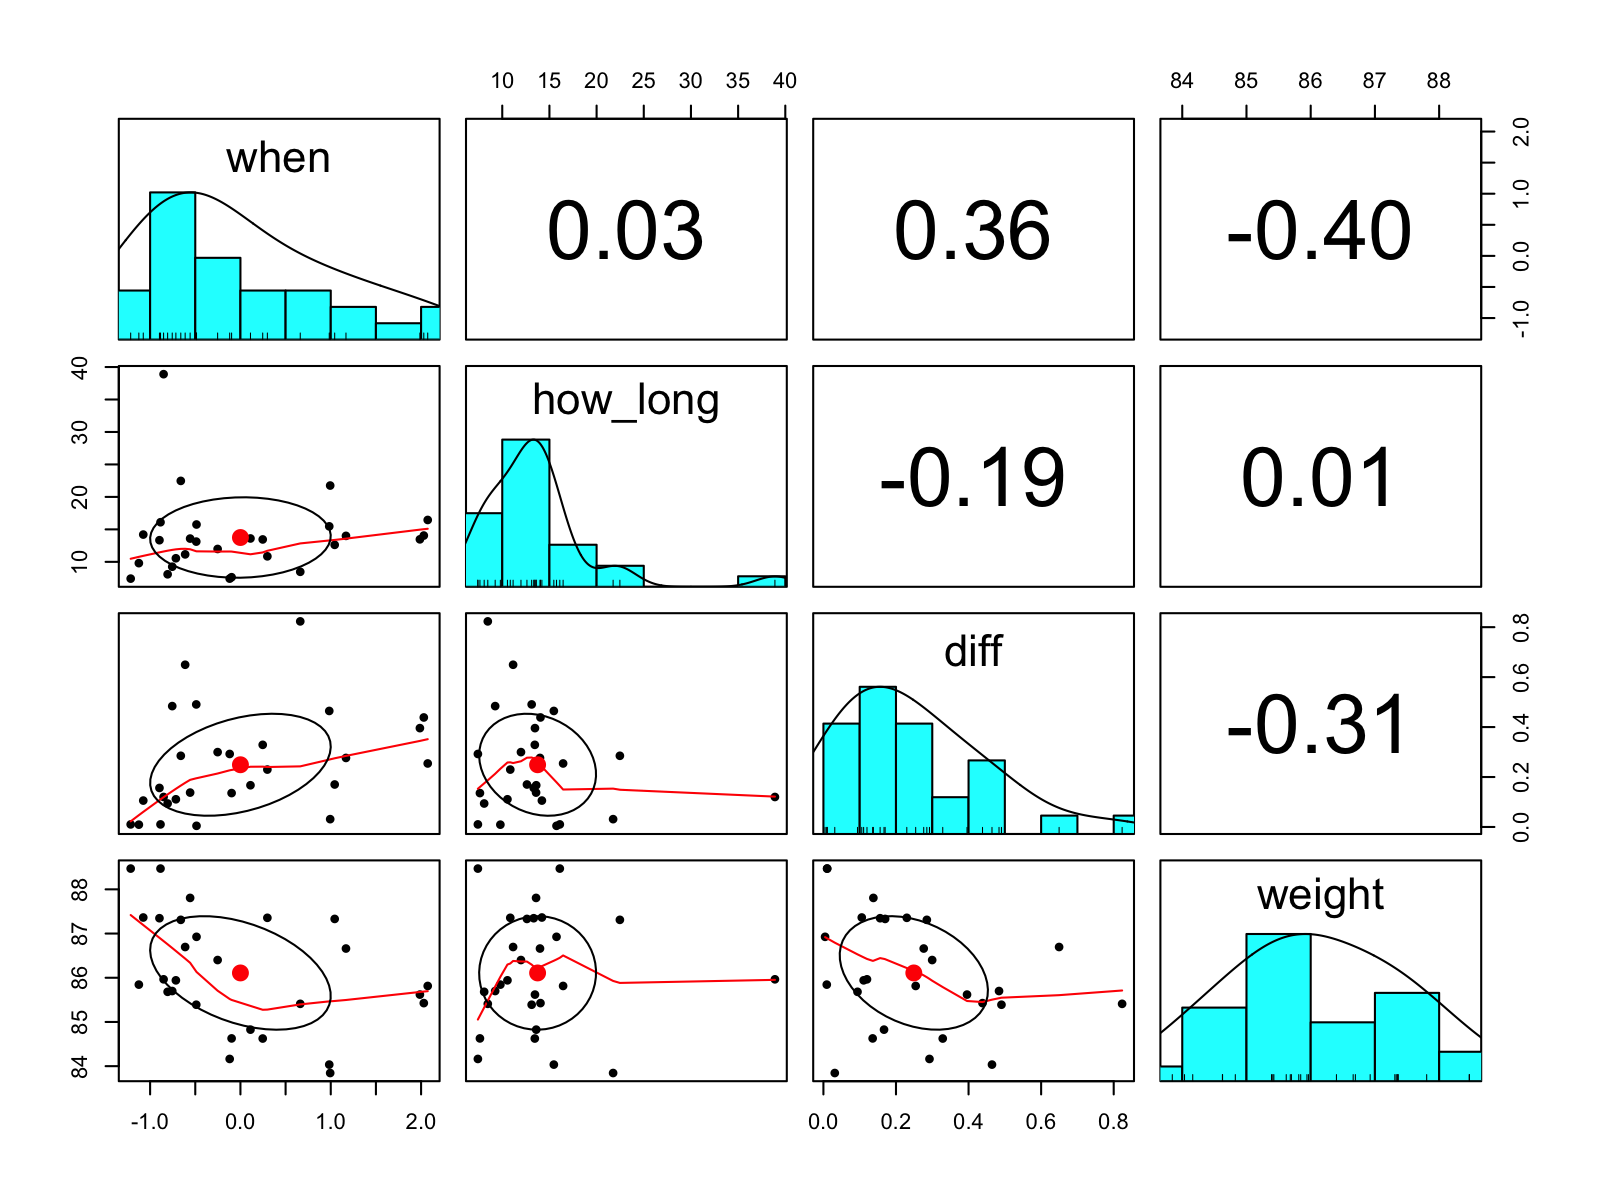
A quick visual summary of the 'poo' data. when, how_long, diff, and weight correspond to the date, the time between measurements, the difference in kg, and the mean kg, respectively. The numbers in the upper-right panels are the Pearson correlations.
Nothing too weird, none of the correlations are really that striking.
Pizzles vs. deuces
So let’s see how the number ones compare to the number twos. Before running this experiment, I expected that the average doodoo would outweigh the average piddle. Although I’m pretty sure more liquid weight makes its way through our bodies each day, I generally micturate more than I defecate. And since the way I measured a number two included the accompanying number one, I thought this hypothesis would be a slam dunk.
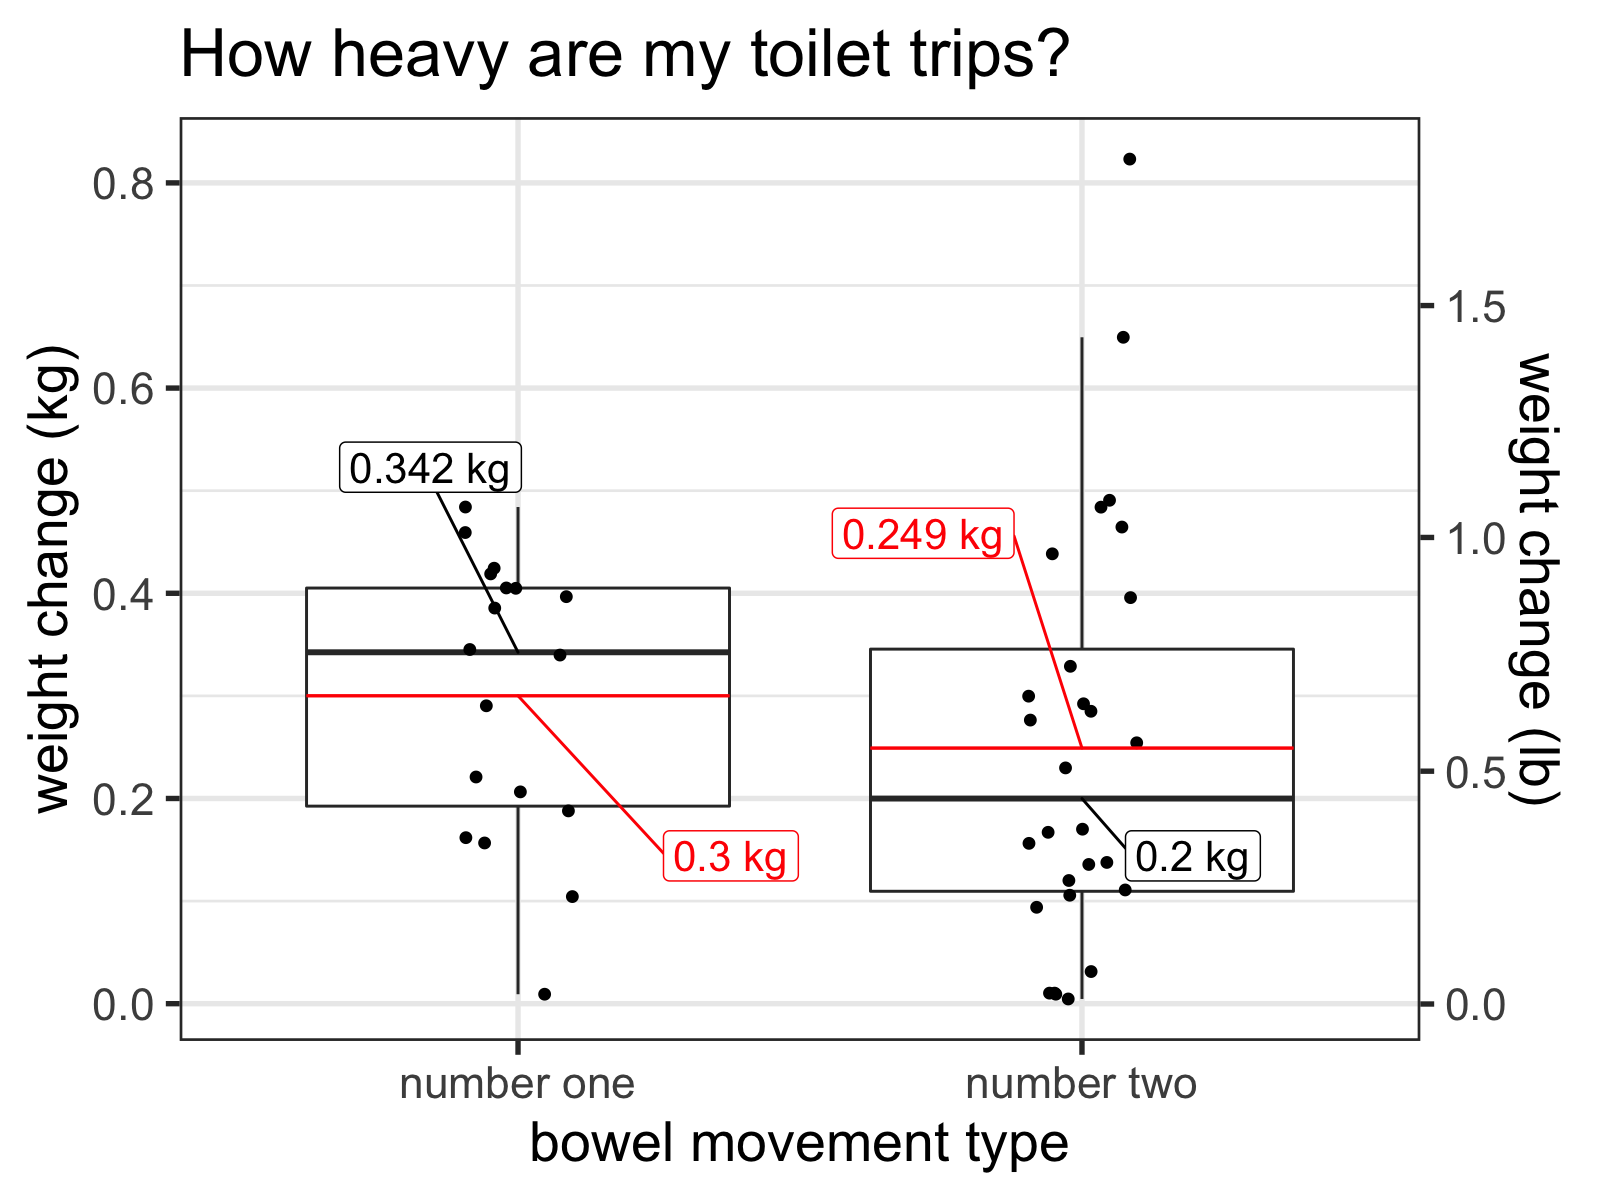
Boxplot of weight of my recorded BMs by type. The thick dark lines represent the medians and the red lines represent the means.
Surprisingly, my recorded tinkles outweigh my recorded dookies in both mean and median! This difference isn’t statistically significant, but it is numerically intriguing.
Thinking about it, I have a few potential explanations.
First, it might be true. Water (essentially what urine is) by volume is pretty heavy. Try picking up a bucket of water, it’s heavier than you might think. Maybe a full bladder is heavier than a full lower intestine. What makes this theory pretty weak is that, as we have all seen, feces most often sink to the bottom of the toilet bowl—they must be denser than water/urine.
More likely, it could be a problem with how I collected the data: I have the feeling that I was more likely to remember to weigh myself when I had to pee really badly, but had an easier time remembering to weigh myself before any poop. With a poop on its way, I would know that I might have to ‘settle’ in for a longer toilet visit, so I would take the time to measure beforehand.
To solve this last issue, I could be incredibly diligent about weighing myself every time I use the restroom. I’d have to stay home for a while, but it could be possible to pull off. If every bowel movement is measured, this bias should decrease. However, this line of reasoning led me to a different thought.
Maybe the wrong question?
The frequency with which we poop is not (fully) determined by how much we eat: many studies say that what is healthy ranges from three times a day to three times a week.6 In my layman’s opinion, this frequency is much more stable than the frequency of urination, which I feel is more determined by things such as how busy we are, etc. And given that the weight per widdle is a function of consumption by frequency, does talking about “individual” urinations make that much sense?
Sure, the frequency of these bowel movements could be interesting in its own right, but I would have to be much more diligent about recording all of them. This just comes back to the second issue I brought up. I approached this question with the lazy understanding that I could just record whichever bowel movements I happened to remember about, and that these stool samples would be representative of an “average” bowel movement. But in reality, thinking about an “average” BM isn’t that useful, especially for urination. Overall “output” rates and frequency seem much more applicable.
Question 3: Lots of questions
Time for a lightning round!
Question 3.1: Does a shower make me lighter?
I’m pretty sure scientists say that you lose dead skin cells, hair, grime, etc. in the process of showering. But is that change noticeable? I recently started weighing myself before and after a shower to see.
Below are the changes in weight, before-and-after, in pounds:
## [1] -0.33 -0.30 0.22 0.26 0.28 0.54Answer: Inconclusive. While the mean is slightly positive, there seems to be enough noise in the data that I can’t tell as of now!
Question 3.2: Longer bathroom breaks = more poo/pee?
Do I stay in the bathroom longer for bigger BMs?
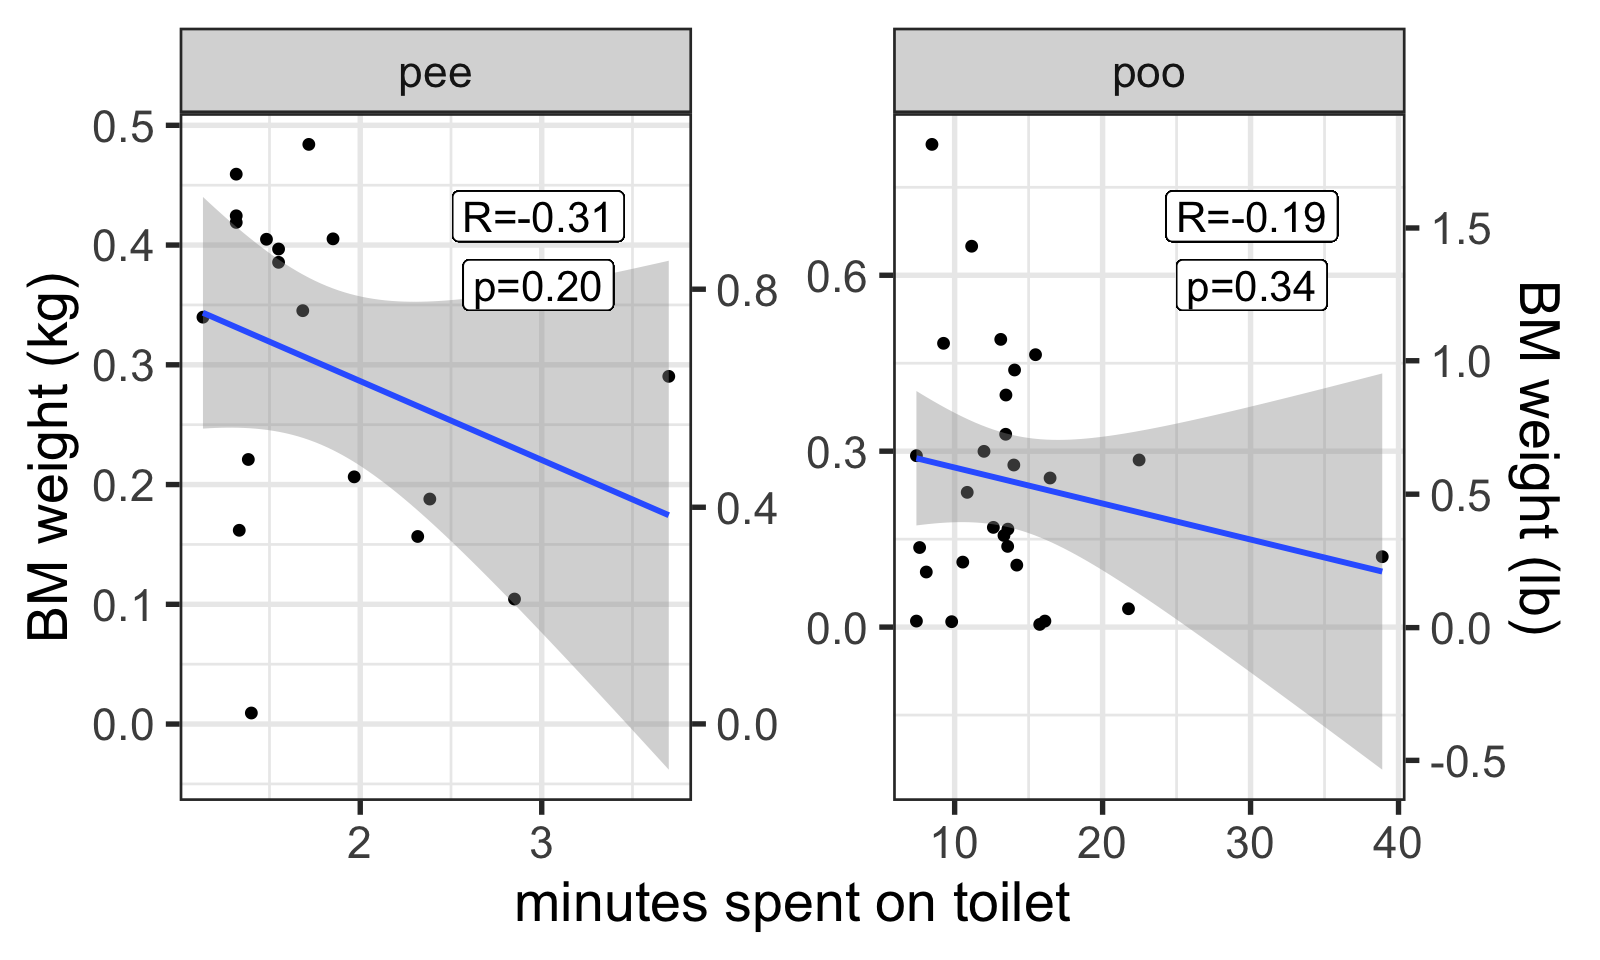
Answer: No. In fact, it looks like I stay longer for smaller poops and pees. Must be messing around on my phone!
Question 3.3: Longer sleep = more weight lost?
If Derek and NPR are right, we lose most of the weight lost in sleep through respiration. If this hypothesis is correct, we would expect that longer sleep = more respiration = more weight lost. Is this borne out in the data?

Answer: Probably! The effect is close to significance, which I’ll take, and the trend is in the right direction!
Question 3.4: How well can GAMs predict before-and-after effects?
In my previous post about using GAMs on this data set, I pondered how well a GAM could capture the weight changes from the before-and-after measurements when you throw everything into a model together.
I decided to test this, with a kind of jury-rigged model comparison. Assuming that the methods I’ve used earlier in this post capture the “ground truth” for the ‘average’ number 1, number 2, and weight lost in sleep,7 I can compare how well different GAMs accurately capture these average changes.
I compared 25 values of k for the time smooth, for GAMs made with both the gamm() and gam() functions. I also compared models with time as a linear predictor (“k=0”), models with the time smooth fit to the “collapsed” data residualized out (“k=c”), and a simple linear regression model.
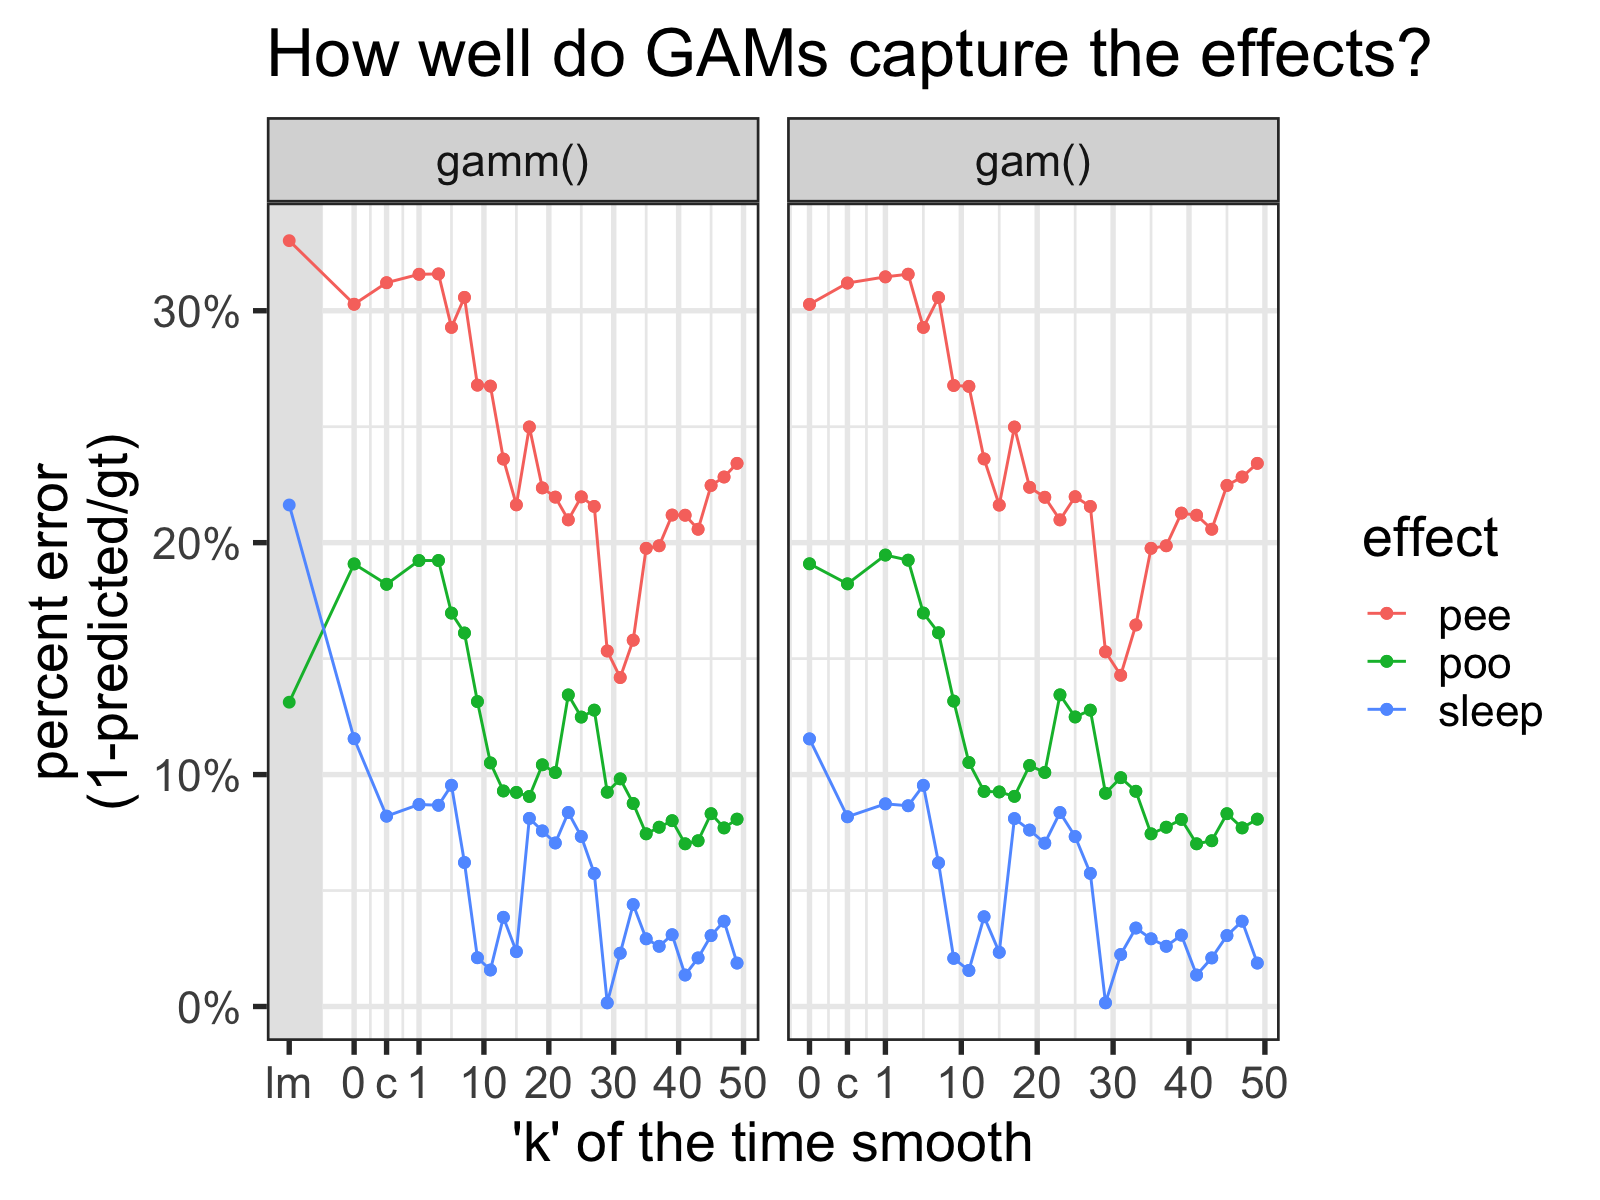
'lm' indicates results from a linear model, '0' is from models with time as a linear predictor, '1' is from models with the fewest possible basis functions, and 'c' is from models with the effect of time from a different model residualized out. For the time smooths of these GAMS, fx is set to TRUE.
First, I should say that “ground truth” estimates for each effect are all within the 95% CI for each GAM. So in some sense, the answer seems to be “yes.” However, as we see, we can get estimates that are ~40% off in some models, so it’s worth being cautious.
Perhaps unsurprisingly, as the number of basis functions increases, the accuracy of the estimations seem to get better and better, up to a point.8
However, in the figure above, I fixed the k term for each smooth, instead of letting mgcv() automatically determine the best number of basis functions with k-1 as the upper bound.
When I repeat what I did above, but let mgcv decide the optimal number of basis functions (represented below via the estimated degrees of freedom), we immediately see that there is much less ‘thrashing’ around of the estimated effect sizes.
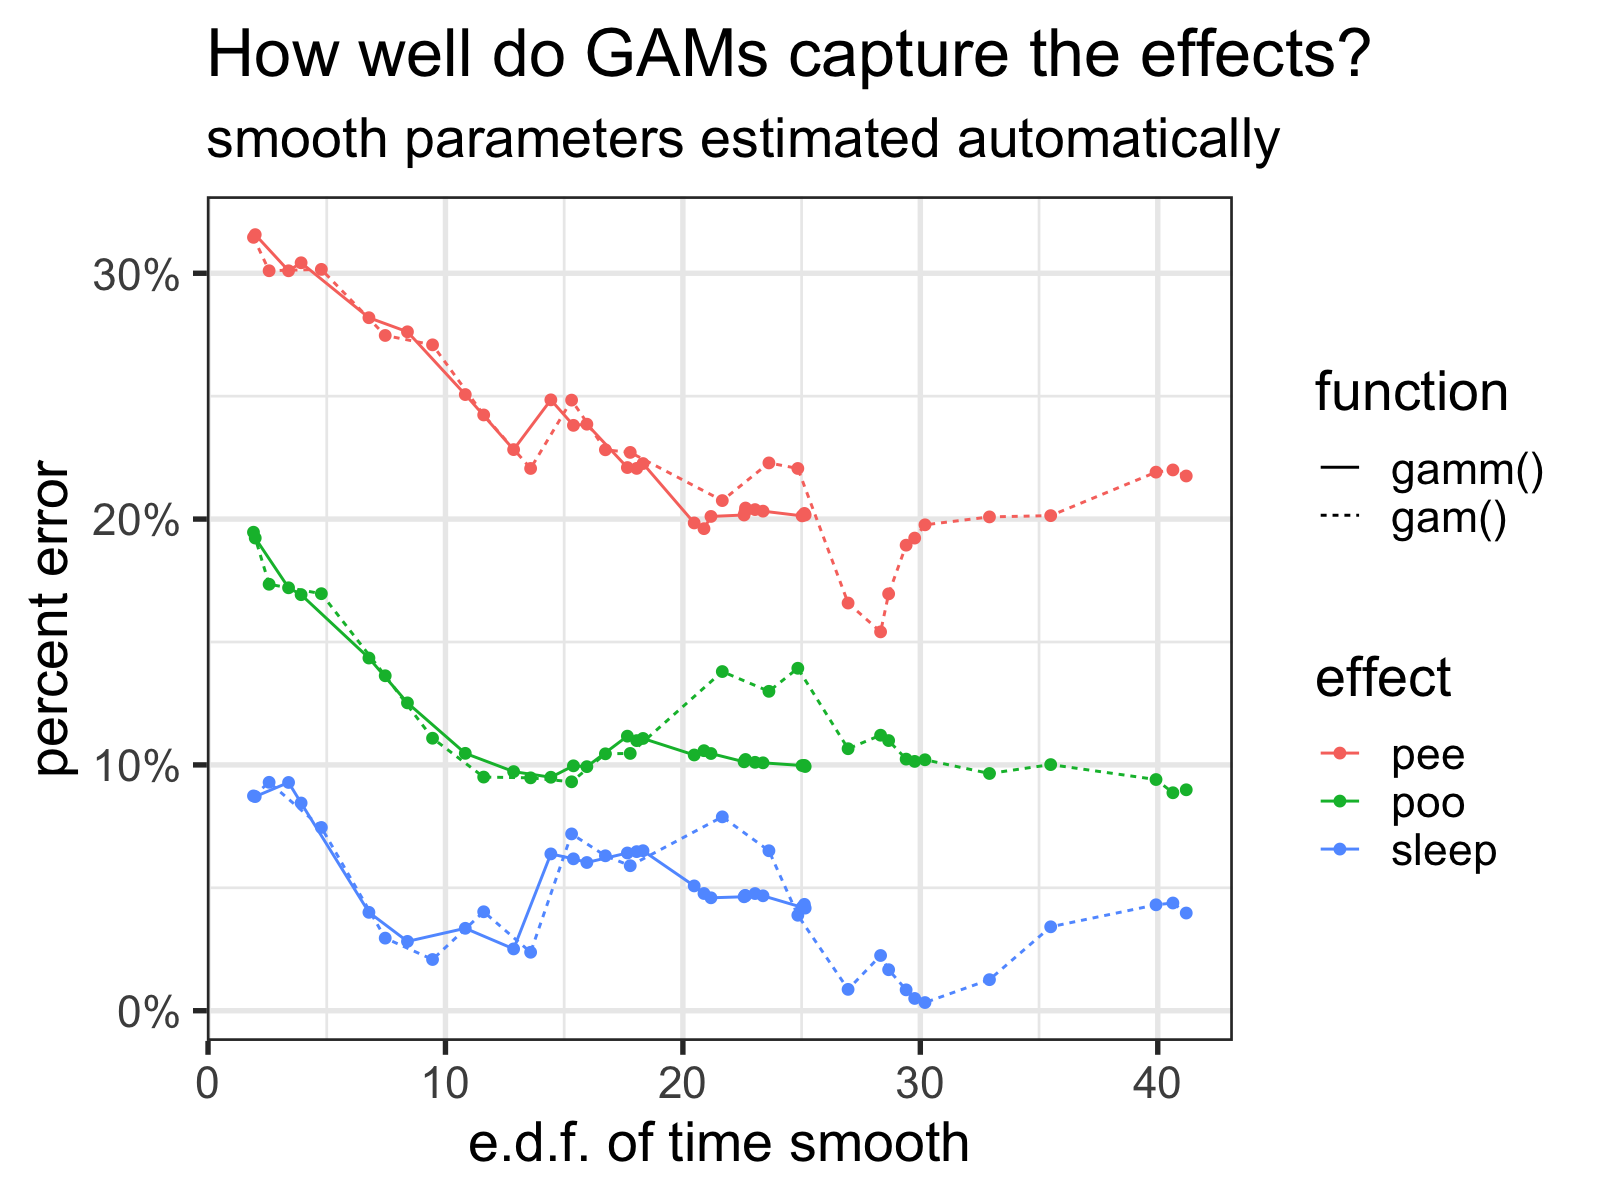
How well the GAMs capture the effects versus the number of basis functions of the time smooth (represented via the estimated degrees of freedom for the smooth) as k increases. Note how the gamm() function tops out around 25.
Lesson learned: don’t fix k unless you really know what you’re doing!
Interestingly though, it seems that gamm() is much more conservative with the amount of wiggliness it bestows the time spline—even when k is set to 50, the edf barely goes above 25, while the edf of gam() go much higher. If anybody has any clue why, let me know!
Source Code:
If you want to see how I did what I did in this post, check out the source code of the R Markdown file!
Footnotes:
-
Eh, bad phrasing. ↩
-
If you want access to the git repo for this project, drop me a line on Twitter and I’ll add you as a collaborator. Otherwise, I’m keeping it private for the time being. 😉 ↩
-
I want to brag about it so much. I’ve set up a subdomain to redirect me to the landing page of my local site:
scale.zachburchill.ml(only available when you’re connected to my home WiFi network). I also have a webhook system that will send push notifications directly to my phone. I feel so 133t. ↩ -
See the issues in my previous post. If not for these issues, I could get a really sexy system going easy-peasy with some real-time dashboards and whatnot. ↩
-
The important functions are defined in the
gathering functionschunk and there’s a commented example in thegroup tagschunk. ↩ -
I’ll go on record that I think both of those frequencies are bizarre, by the way. ↩
-
I’m making a lot of assumptions here. ↩
-
I originally had a ‘time-of-day’ spline in the GAMs, but it ended up eating up the variance of the sleep effect (since I have a somewhat regular bedtime), and led to very unstable estimates. ↩